SylSmart Energy
Powering Your Drive to Net Zero
Powering Your Drive
to Net Zero

Create your path to Net Zero supported by in-depth data and insights – SylSmart Energy is an advanced energy monitoring and analytics platform that empowers businesses to take action regarding their carbon emissions and energy consumption.
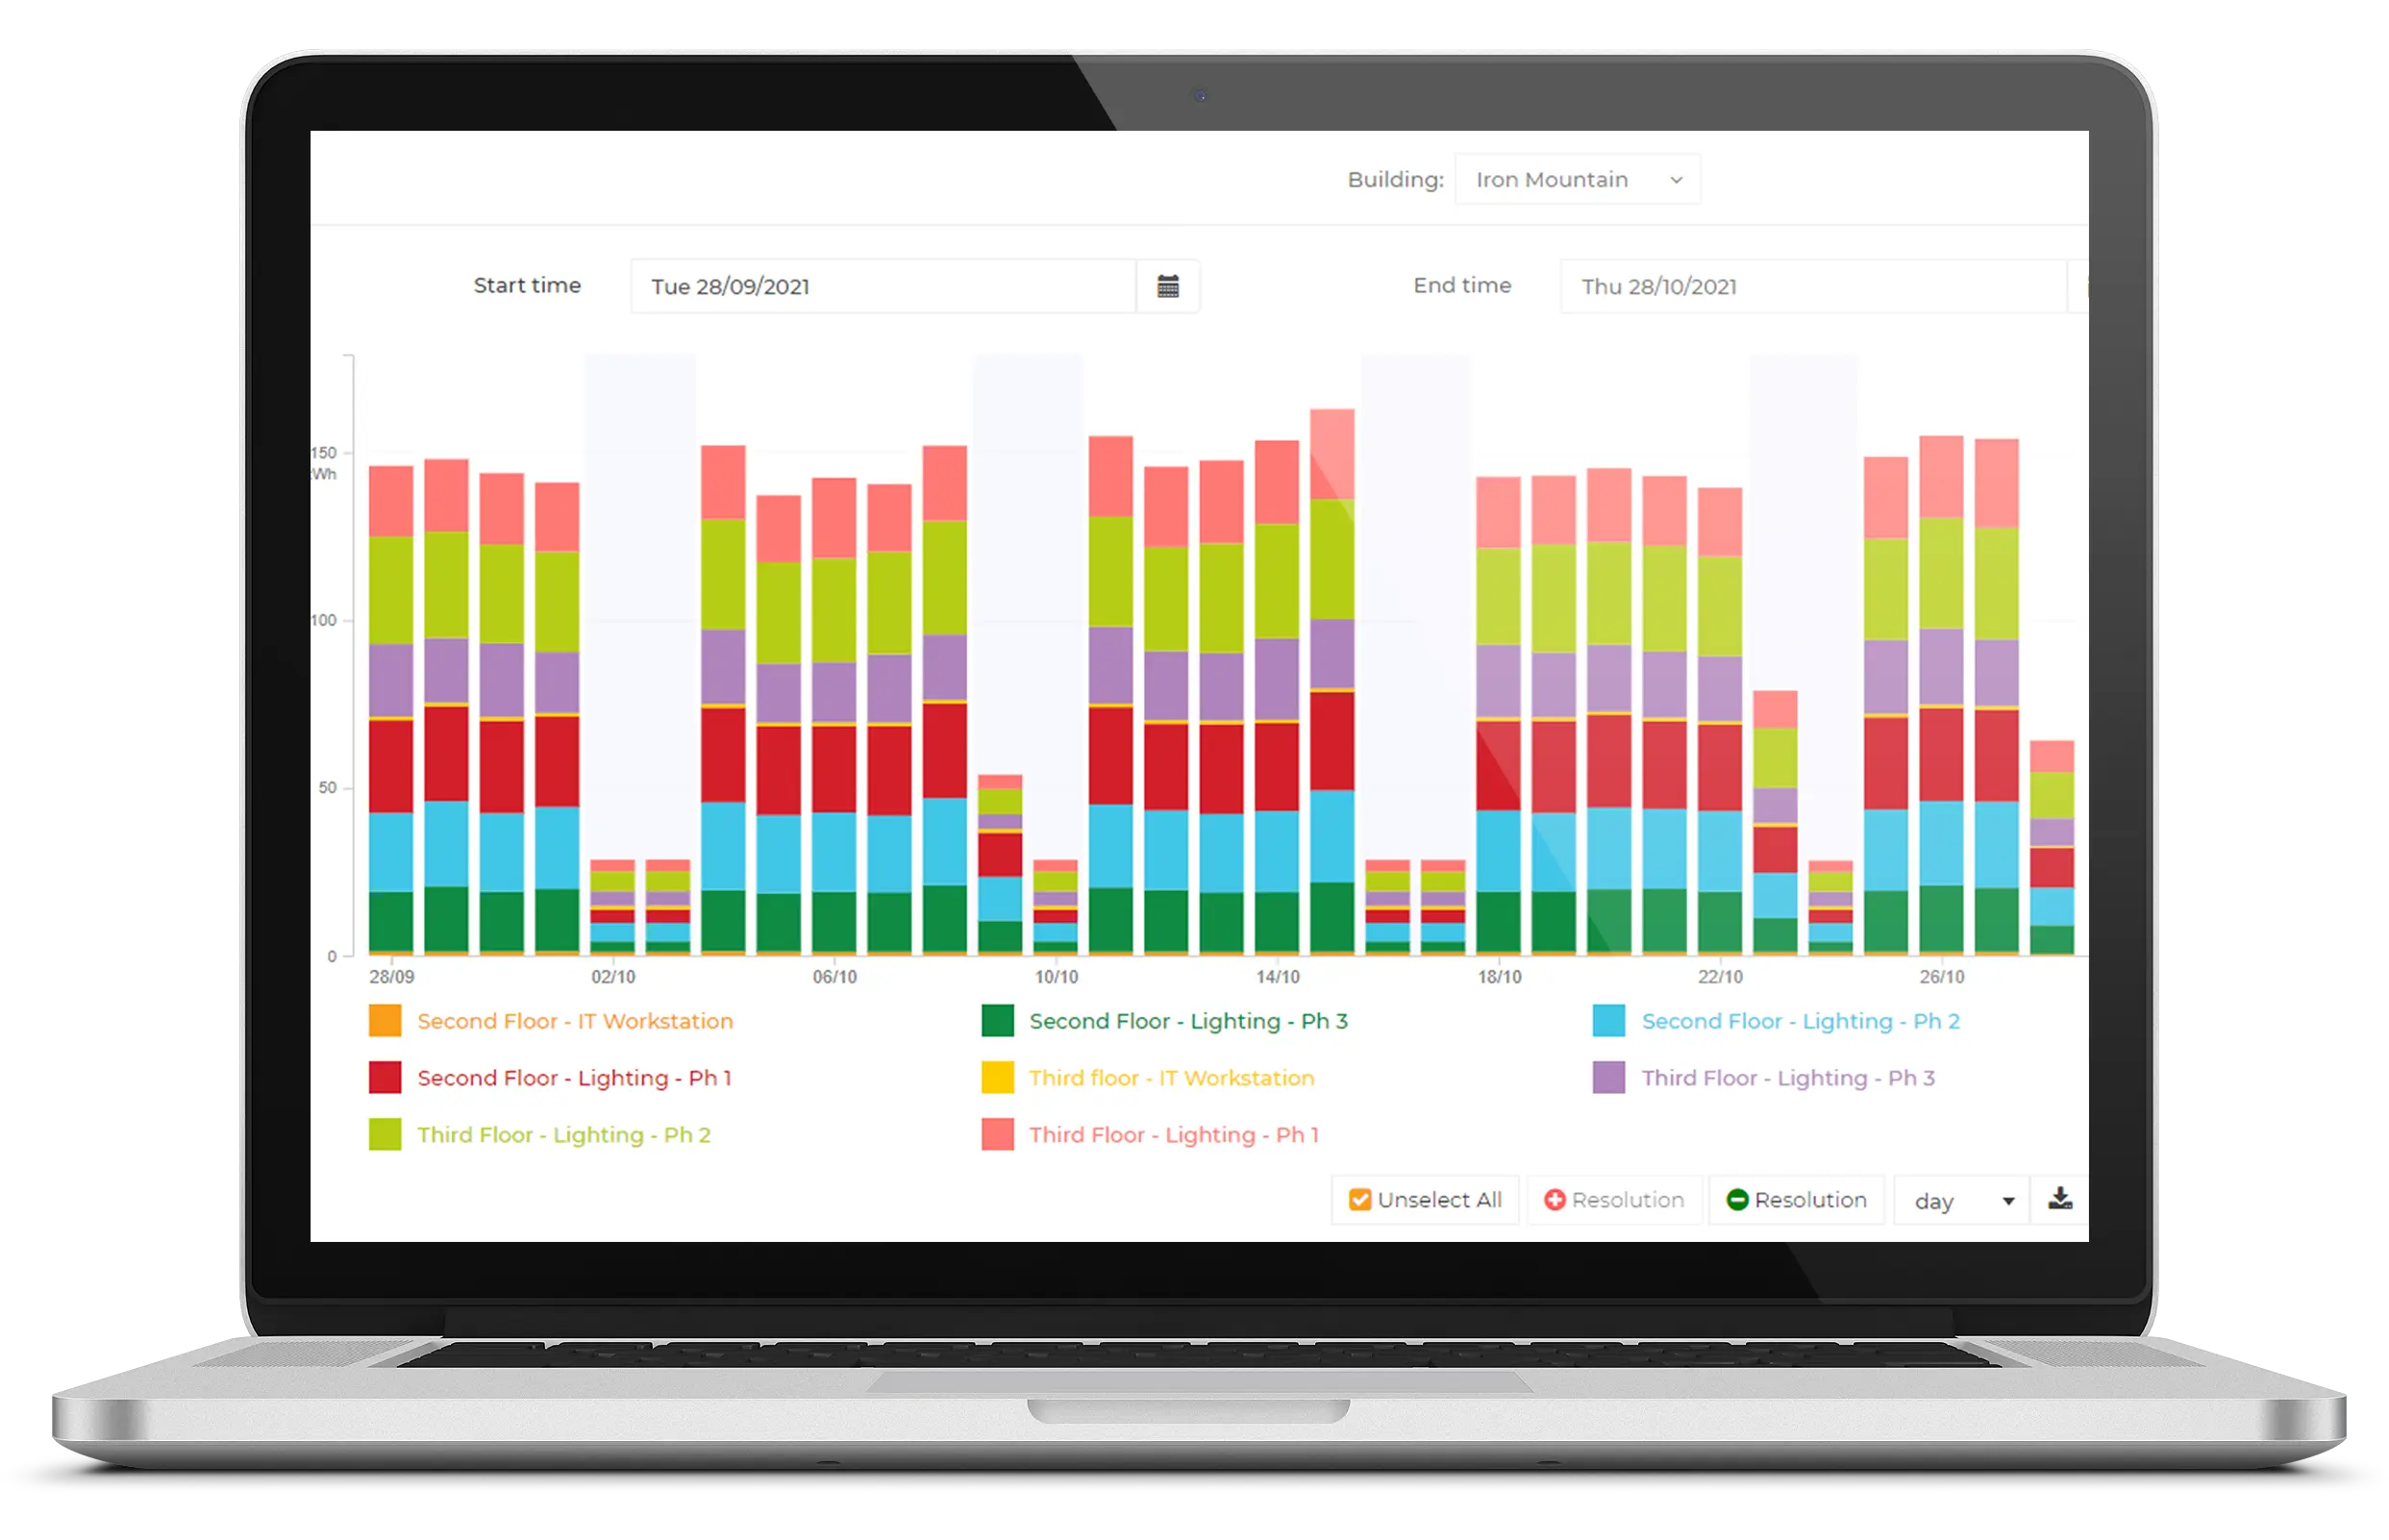
What Can the Solution Do for You ?
Identify costs
Access energy consumption data of site
Discover high-cost areas
Analyse consumption
Oversee your premise


Control Consumption
Plan cost saving actions to achieve maximum energy efficiency through infrastructure upgrades
Roll out action plan
Verify and adjust forecasted savings
Report annual performance
Create Strategies
Visualize reduction in OPEX and carbon savings supported by real-time analytics
Share your energy consumption reports and fulfil your obligations
Set goals and milestones
Activate alerts and notifications


Build Sustainable Business
Application Areas


How does it work ?
Monitor all energy usage on your site and connect to a variety of systems to gain true insight into how you utilize energy. The platform is designed to make it easy for users of any type to gain insights ranging from high level summary information to detailed circuit level information.

Connected Auditors
High granularity of data gained from monitoring individual circuits

Automated data collection
Gather data from your Energy service providers (3rd party)

Manual inputs
Upload your invoices, including your historic energy consumption
Intelligent Dashboards
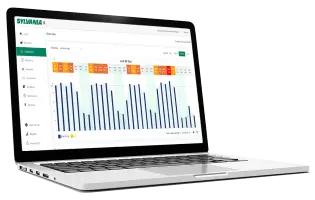
Actionable Insights
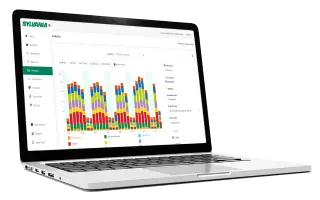
Dashboard & KPI
High-level overview of your sites’ energy and carbon consumption over an adjustable time period.
Real Time View
Gain real time insights into the energy signature of your circuits, including KVa, KW and power factor.
Measure & Verify
Measure your baseline and verify the efficiency of your new installations or energy reduction strategies.
CSR Reporting
Exportable in-depth reports on your energy consumption sent directly to your inbox.
Multisites
Visualise the performance of all your sites from the convenience of one dashboard.
Floorplan
Easily visualise the location of your circuits on each floor plan.
Analytics
Gain in-depth insight into the energy consumption of your site. Plan and verify your carbon reduction strategies and set your target milestones.
Rules & Notifications
Get alerted when excess energy is being used in your site or anomalous operation is detected.
How do You Benefit ?
Are You a Facility Manager ?

Gain insight into the performance of your site.
Create tailored alerts such as excessive power consumption or any anomalous working is detected.
Assess performance of assets and plan preventative maintenance.
Are You an Energy Manager ?

Identify and implement strategies for saving energy.
Gain data to drive energy schemes.
Benchmark sites that are performing well.
Gives visibility when goals are achieved.
View all utilities in one platform.
Generate detailed reports.
Are You a Building Owner ?

Helps assess their current energy consumption
Shows energy savings and ROI, secures subsidies, and shows savings in OPEX for the acquisition of Solar PVs or new machinery.
Rebill tenants with our accurate MID certified meters.
Case studies


We’re here to help!
Whether you have a question, feedback, or need assistance, please feel free to get in touch.